
Benchmarks
Ecommerce Conversion Rate Benchmarks by Device and Traffic Source
A single conversion rate hides more than it tells. Split by device and by where the visit came from, and the block becomes obvious.
On this page
Every store we read has one conversion rate on the dashboard and four very different ones underneath it.
By device
Placeholder figures for the test build.
What is the #1 thing holding back your ecommerce revenue?
Get an instant PDF audit powered by The Ecommerce Engine™ methodology, refined through five years of research and development.
By source
| Source | Conversion rate | Share of sessions |
|---|---|---|
| Direct | 4.2% | 18% |
| Organic search | 2.8% | 31% |
| Paid search | 2.4% | 16% |
| Paid social | 1.1% | 27% |
| 5.6% | 8% |
Reading the two together
Paid social sends the most sessions and converts the worst, which is normal and not in itself a problem. It becomes one when the mobile experience those sessions land on has never been looked at.
If mobile is half your traffic and a third of your conversion rate, the store has one job this quarter.
Try Us Free for 4 Weeks. Up to $5,000 in Agency Fees, On Us.
Four weeks of agency work on us, with no commitment and no obligation to carry on. For ecommerce brands at $50K+ a month and $10K+ in ad spend.
Next month’s intake closes in00days00hours00minutes00seconds

Co-founded The Obsidian Co. in 2021 and built the Ecommerce Engine, the model the whole company works from.
Writes about The Ecommerce Engine, Pricing, Operations
More articles
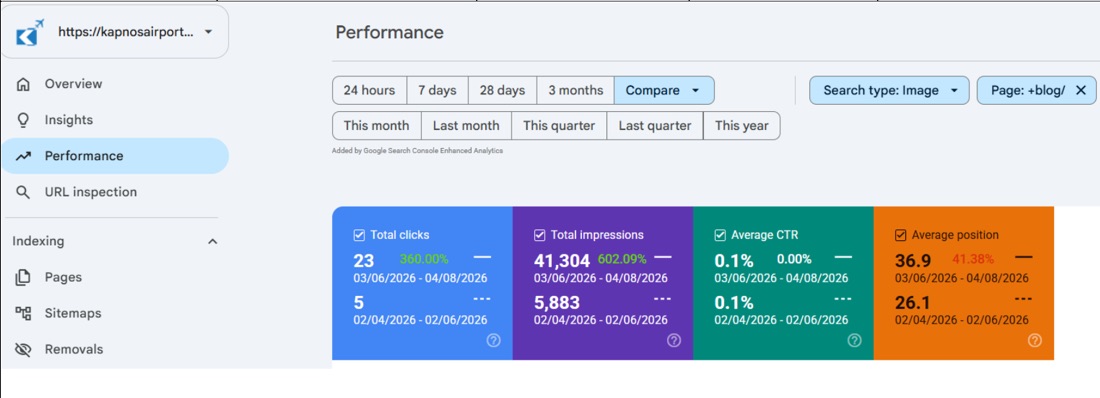 BenchmarksEcommerce Organic CTR Benchmarks: What a Good Click Through Rate Looks LikeImpressions are not the number to watch. Here is what organic click through rate looks like across ecommerce stores by position and by page type, and what to doFlorian Moraru · 3 November 2026
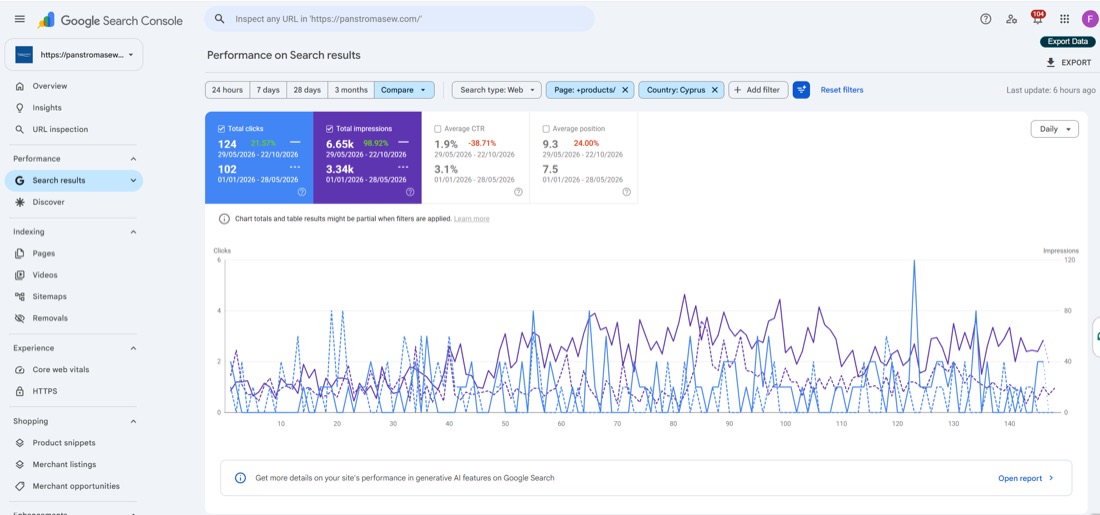 BenchmarksThe Technical SEO Checks Worth Running on Any Ecommerce StoreCrawl, indexation, faceted navigation and structured data. The four places a catalogue quietly loses search visibility, and how to check each one.Alexander Wassberg-Demetriou · 2 October 2026
 Paid MediaEcommerce Meta Ads Benchmarks: CPM, CTR and Cost per Link ClickWhat the three numbers on the front of a Meta account look like across ecommerce advertisers, and which of them is worth acting on first.Sotiris Maronou · 28 October 2026