
Benchmarks
Ecommerce Organic CTR Benchmarks: What a Good Click Through Rate Looks Like
Impressions are not the number to watch. Here is what organic click through rate looks like across ecommerce stores by position and by page type, and what to do when yours sits under it.
On this page
A store can rank well and still be ignored. Position tells you where you are on the page; click through rate tells you whether anyone is choosing you once they get there, and it is the number that moves first when a title or a snippet is wrong.
These are the figures we work against on the ecommerce accounts we run, what they look like by position and by kind of page, and what we do when a store sits under them.
What counts as a good organic CTR
There is no single number. A click through rate is only good or bad against the position it was earned at: 4% in position eight is strong, and the same 4% in position one means the result is being passed over.
Across the ecommerce accounts we run, 12 months to October 2026. Non-branded queries only.
Read it as a floor rather than a target. If a page sits a long way under the figure for its position, the ranking is not the problem.
The benchmarks by page type
The kind of page changes what a reasonable rate is. A product page caught on a specific model is chosen far more often than a category page caught on a broad term, even at the same position.
| Page type | Median CTR | Top quartile | Median position |
|---|---|---|---|
| Product pages | 4.8% | 8.1% | 7.2 |
| Category pages | 2.9% | 5.6% | 9.4 |
| Brand and homepage | 21.3% | 34.0% | 1.4 |
| Buying guides | 3.4% | 6.2% | 8.8 |
| Help and support | 6.1% | 11.4% | 5.1 |
Two things fall out of this table every time we go through it with a client:
- Category pages are the weak link in most catalogues. They carry the broad terms and the most competition, and they are usually the pages nobody has written a title for.
- Brand terms flatter the average. Leave them in and a store looks healthy at 9% overall while every page that could win a new customer sits at 2%.
What is the #1 thing holding back your ecommerce revenue?
Get an instant PDF audit powered by The Ecommerce Engine™ methodology, refined through five years of research and development.
Where the figures come from
Everything above is read out of Search Console for the accounts we run, exported month by month and compared against the same window a year earlier. We publish the window because a benchmark without one is a slogan.
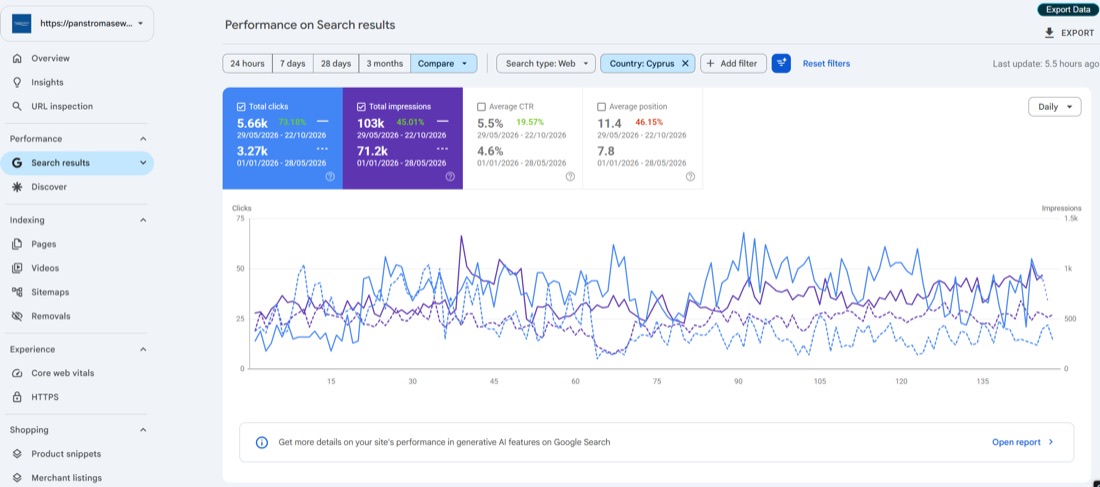
That shape matters. When visibility is the problem, impressions rise first. When the snippet is the problem, impressions stay where they are and clicks move on their own.
If impressions did not move and clicks did, nothing about your ranking changed. Someone simply gave people a better reason to choose you.
What to do when you are under the benchmark
The work is ordinary and it is nearly always the same four things, in this order:
- Rewrite the title against the query, not the product name. The title that wins is the one that repeats what was typed and adds the thing that decides it: price, size, delivery, stock.
- Write the description as the second line of the title. It is not a ranking factor and it is read anyway.
- Earn the extras. Review stars, price and availability in the snippet are the cheapest click through rate you will ever buy, and they are structured data rather than copywriting.
- Leave it eight weeks and measure the same window. Snippets are rewritten by Google often enough that a fortnight tells you nothing.
On the account in the picture above, that sequence moved average CTR from 4.6% to 5.5% over five months, with impressions up 46% at the same time. Neither number would have been enough on its own.
How this fits the rest of the engine
Click through rate sits in the Traffic section of the Ecommerce Engine™, next to CPM, CPC and the paid equivalents. It is scored against the goal you set rather than against a universal number, because a store selling one €4,000 product has nothing in common with a store selling two hundred €40 ones.
A low CTR with healthy impressions is one of the clearest blocks the engine finds: the demand is already there and the store is not taking it. See how the engine reads it, or how we work on the SEO behind it.
Try Us Free for 4 Weeks. Up to $5,000 in Agency Fees, On Us.
Four weeks of agency work on us, with no commitment and no obligation to carry on. For ecommerce brands at $50K+ a month and $10K+ in ad spend.
Next month’s intake closes in00days00hours00minutes00seconds

Runs the SEO work on the accounts here, from technical audits to the content that earns the clicks. Ten years in search, the last six of them on ecommerce catalogues.
Writes about Ecommerce SEO, Search benchmarks, Catalogue structure
Google Partner. Three Global Social Media Awards with the team.
More articles
 BenchmarksEcommerce Conversion Rate Benchmarks by Device and Traffic SourceA single conversion rate hides more than it tells. Split by device and by where the visit came from, and the block becomes obvious.Michalis Nikolaou · 14 October 2026
 BenchmarksThe Technical SEO Checks Worth Running on Any Ecommerce StoreCrawl, indexation, faceted navigation and structured data. The four places a catalogue quietly loses search visibility, and how to check each one.Alexander Wassberg-Demetriou · 2 October 2026
 Paid MediaEcommerce Meta Ads Benchmarks: CPM, CTR and Cost per Link ClickWhat the three numbers on the front of a Meta account look like across ecommerce advertisers, and which of them is worth acting on first.Sotiris Maronou · 28 October 2026